A data-science roadmap from absolute zero. For absolute beginners! You do not need a PhD to do data science!
Recipes tell you nothing. Learning techniques is the key.
— Tom Colicchio
There is endless talk in industry about how and how long it takes to become a good data scientist or analyst. Much of the answer is relative: it depends on how you think about data and how far you want to take it. You can start with data analytics (knowledge from data). You can also move from analytics (about 5–6 months in a focused track) into data science (12–16 months).
Data science is a banyan tree of a subject. In my view, before diving that deep, learn how to take insight from data (analytics). Once you understand how data is handled and what outcomes it can produce, the science becomes far straighter. Many people watch thousands of data-science tutorials, lose interest mid-way because the basics never stuck. That is why this guideline exists.
Again — this roadmap is straight and selective: only parts of the full data-science map, with analytics first because it is easier to start.
| Timeline: | Data Science / Analytics |
|---|---|
| Data analytics | 5–6 months |
| Data science | 10–16 months |
A learning framework helps at the start: what to add, which resources exist now, which tools are in use. The framework is a process; understand the process and you understand which tools matter later — and they will change. That is why I do not push being “tool dependent”. Know why you learn something and whether it is relevant — at least at the broad-line level.
Learning roadmap: what is it?
Like a mind map — multi-level skills without the pain. Here we name the skills worth learning, how to measure outcomes at each level, which tools fit, which techniques help mastery, where things get easy, and where complexity rises.
Data science summary; (*) = analytics
| Data Science | Analytics |
|---|---|
| End-to-end pipeline | optional |
| Hierarchy of needs | * |
| Data science workspace | |
| Basic math, linear algebra | |
| Statistics, distributions | * |
| Programming, Python / R | * |
| Exploratory data analysis | * |
| Data visualization | * |
| Professional visualization tools | * |
| Business analytics / intelligence tools | * |
| Model building, machine learning | |
| SQL skills | * |
| NoSQL (optional) | |
| Data analytics capstone | |
| Data science capstone | |
| Data engineering, APIs |
How does one become a successful data scientist/analyst? At the very start, one tiny end-to-end project (a few lines of data) builds intuition; the rest follows. Understanding the pipeline — how data transforms through each operation — is essential. Two projects cover it.
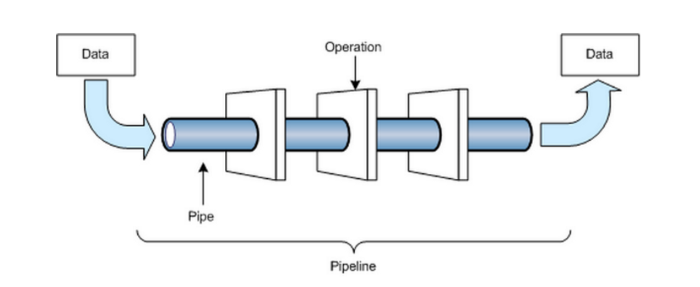
Some math and statistics as theory make everything downstream easier. Not hardcore math — just enough for the work. Later, how those numbers power models becomes obvious. Alongside theory you need a programming environment. If you have no programming background, R is nearly a godsend; if you already code, start with Python. R still has an outstanding learning curve for understanding data analysis.
Knowledge from data drives decisions; visualization explains that perspective. R and Python have extraordinary visualization tooling. Finally you must test learning in real life — capstone data-science projects. Summary done; on to the detail.
Basic end-to-end pipeline idea (optional)
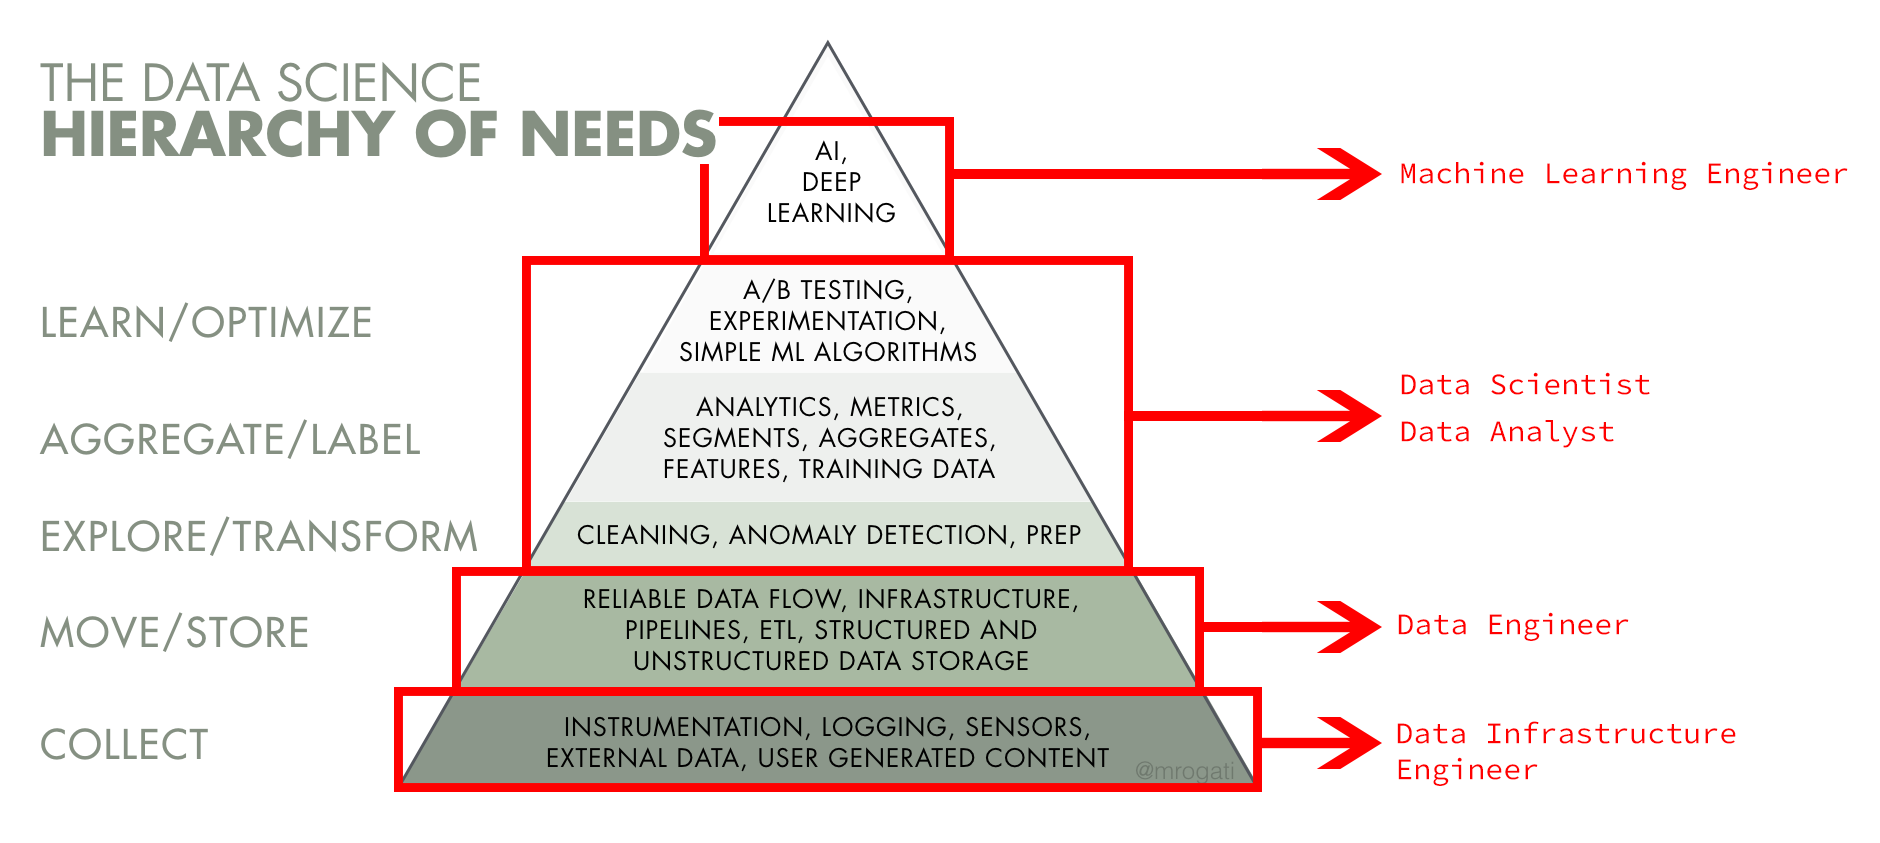
Monica Rogati’s Data Science Hierarchy of Needs is essential for the big picture. Variants are online; the diagrams stay in English for clarity, but everyone should look up Maslow’s theory.
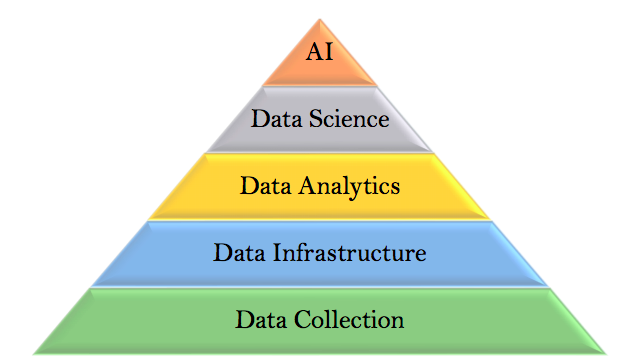
Data science hierarchy of needs *
Interconnected diagrams; details below.
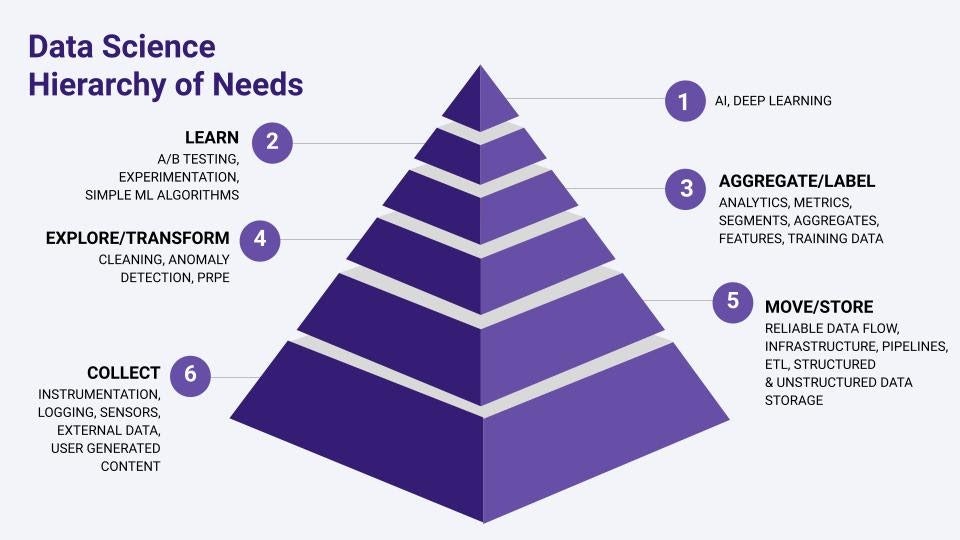
Data collection is the base: instrumentation, logs, datasets, sensor data. Without reliable collection, later stages fail. Storage and infrastructure (pipelines, ETL) come next. Then exploration and transformation — cleaning, anomaly detection. Step three is aggregation, labeling, analytics, metrics and feature segmentation; many people find it the most attractive. But starting at step six shows the real difficulty: collection and cleaning eat ~80% of data-science time. Analytics enables basic ML algorithms and experiments like A/B testing. Most product work happens at step two; deep learning and modern AI sit at the top — where open-source frameworks power every level worldwide.
Deep dive: hierarchy of data-science needs (not for everyone)
Worth repeating for career-track data science.
Understand the difference between data analyst, data engineer and data scientist before the big stories. Job titles mislead; read the job descriptions. Monica Rogati’s hierarchy again, deeper: without knowing how data is collected, nothing above it — ML, AI — works properly. AI will not magically solve everything; plenty of low-hanging work exists before models. Data must be stored and manipulated before it is useful; pipelines move data between formats; data engineers own complex, distributed systems, cleaning and transforming so queries make sense. Analysts, business analysts, product managers and software engineers then answer business questions with queries — that is the analyst domain. Stage four powers A/B frameworks and product fine-tuning (which button works, which features matter). The top stage needs clean, well-labeled data; when linear models fail, deep learning may follow.
Job descriptions: where do analysts, engineers and scientists fit?
Engineers work on collection, exploration and transformation — the bottom blocks. Software engineers wire front- and back-ends and capture user data. Analysts work at aggregate/labeling level; they surface direction and needed work, with sharp communication. Many companies list “data analyst” but mean data scientist; scientists go further technically, often with research scientists, ML engineers, and sometimes PhD candidates — or one scientist does everything at a startup. Always read the description; it tells you whether the role fits.
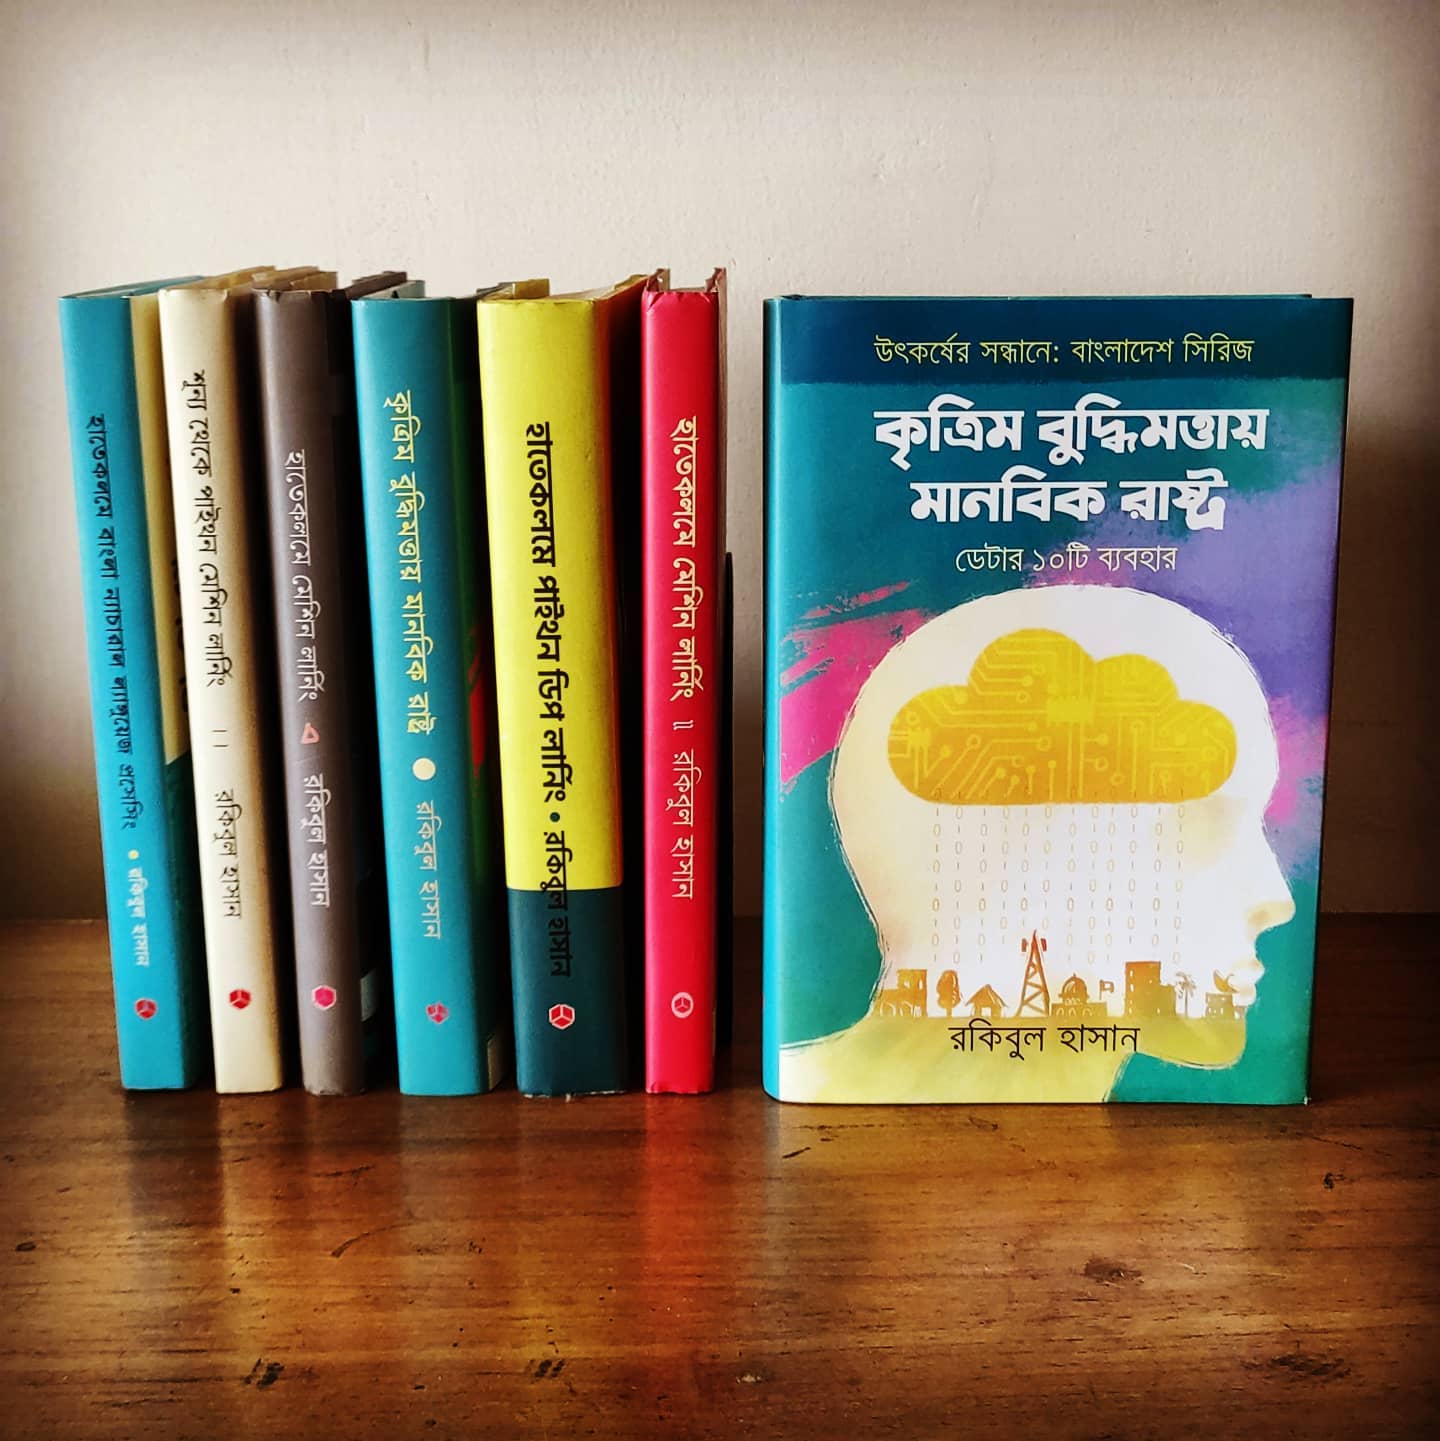
My first two books help: half of Hatekolome Machine Learning is personal experience and stories; From Zero to Python Machine Learning starts from zero programming background, walking the pipelines in Python and R the gentle way. No book purchase needed at first — two tiny projects:
| Project | Book link |
|---|---|
| Iris species project | From Zero to Python Machine Learning |
| Titanic project | Hatekolome Machine Learning |
A video walkthrough builds intuition fast:
(Python) data science workspace, Anaconda
Everything is here: every hierarchy stage’s open-source tools, Jupyter notebooks included. Or use Google Colab if you prefer not to install anything.
Basic math, linear algebra, calculus
Linear algebra is a great start — scalars, vectors and matrices before processing data; transformations, inverses, transposes and multiplication; dot and cross products via Khan Academy. Calculus (derivatives, differential equations, integrals) is easy to code in Python or R; knowing the math explains the outcomes and strengthens data-engineering understanding.
Statistics, descriptive, with distributions *
Statistics underpins data science. Descriptive stats and distributions — max, min, median, mode, mean, central tendency — tell a dataset’s story; a few good lessons cover normal distribution. Histograms, scatter plots, box plots, variance and standard deviation are everyday math now. Confidence intervals and hypothesis testing follow research practice: population proportions, p-values, significance tests. It looks hard at first; a little searching shows how straightforward it is.
Probability core ideas: experimental probability, independent/dependent events, conditional probability — Google and Khan Academy are enough.
Programming skills, Python / R environment *
Why a programming environment? To pull data (APIs, scraping) and to manipulate/transform it (ETL). That is where programming enters — not earlier.
R
For non-programmers, R is a godsend: built for statistics, thousands of libraries can do in one line what might take five in Python. Visualization tools remain world-class. Start with my first book Hatekolome Machine Learning — even class-10 students follow it.
Python
Programmers usually start with Python; its data-science libraries make the journey easy. From Zero to Python Machine Learning then Hands-On Python Deep Learning.
Four jobs on data with Python
Collection first — without loading data into your system nothing starts.
Data collection
pandas is the famous basic library; Selenium and Scrapy for more advanced scraping. Search those keywords.
Exploratory data analysis, EDA *
After collection, clean and transform with Python libraries. NumPy and pandas store and manipulate; EDA explores patterns inside the data.
Data visualization (EDA, explore) *
Humans see patterns when data is plotted — bars, box plots and pie charts show how features interconnect. Matplotlib and Seaborn do this beautifully in Python.
Business analytics and intelligence tools *
94% of people using data in their current job role agree that data helps them do their job better.
To communicate anomalies and relationships to stakeholders, use professional BI tooling: Seaborn open-source; for speed, Excel, Google Sheets, Tableau and Microsoft Power BI are another level. Many of my videos cover Excel, Tableau and Power BI.
Excel, Google Sheets, Tableau, Power BI *
Big organizations still use proprietary tools; thousands of studies optimize how fast users produce reports. Excel on everyone’s machine proves the point; Google Sheets is free with corporate limits; Tableau and Power BI cost more but excel at business analytics.
(Python) model building, machine learning
The last stage: turning analytics knowledge into models. Statistics and math behind models matter even when tools do the work — especially understanding why models behave. scikit-learn at basic level; TensorFlow for deep learning; PyTorch for research. scikit-learn is superbly documented; my second book covers it; Hands-On Python Deep Learning covers TensorFlow.
SQL skills *
Where data lives matters. Relational-database concepts and SQL queries — DDL (create, alter, drop…), DML (select, insert, update, delete), DCL (grant, revoke), TCL (commit, rollback), joins and unions. Start with MySQL.
NoSQL (optional)
Growing for unstructured data — MongoDB is the usual example. Useful later.
Data science / analytics capstone
Without one real end-to-end project, learning can collapse. Industry-related capstones connect foundations to real-world scenarios.
Global Superstore project (analytics) *
A realistic management project — head-scratching on purpose.
Movie recommendation project
How Netflix and YouTube recommend is how Daraz, AliExpress and Amazon recommend what we view or buy. A simplified recommender touches a huge slice of e-commerce.
Customer churn management
Customers are assets. Predicting who stays, who switches — or when an employee may leave — lets business and HR reduce unpleasant surprises.
Portfolio showcasing *
Show the work; get feedback; build confidence; connect learning to delivery with a portfolio site. GitHub Pages is ideal early on — this site is one. Connect networking events too.
Optional: data engineering, APIs
Deployment, API communication (JSON, REST, OpenAPI), and sometimes graph theory, network analysis, time series, optimization and combinatorics help you fit any ecosystem.
Building a data science community
We need to build it.
The first four Bangla books for data science / analytics
